[Classic Paper Review] The Origin of Kessler Syndrome — Collision Frequency of Artificial Satellites and the Creation of a Debris Belt
2026-07-06
The Origin of Kessler Syndrome — Collision Frequency of Artificial Satellites and the Creation of a Debris Belt
Paper Information: Donald J. Kessler and Burton G. Cour-Palais, "Collision Frequency of Artificial Satellites: The Creation of a Debris Belt," Journal of Geophysical Research: Space Physics, Vol. 83, No. A6, pp. 2637–2646, June 1, 1978. DOI: 10.1029/JA083iA06p02637
Research Institution: NASA Johnson Space Center
Publication Timeline: Received October 31, 1977; revised February 24, 1978; accepted March 2, 1978
1. Introduction: A Neglected Danger
In 1978, when Kessler and Cour-Palais published this paper, humanity had only been in the space age for 21 years. At the time, the Soviet Kosmos 954 nuclear-powered satellite had just crashed in northern Canada, sparking international concern about orbital object re-entry. Yet few people realized that low Earth orbit was brewing a far more profound and irreversible crisis.
By 1978, the North American Aerospace Defense Command (NORAD) had cataloged approximately 4,500 objects in orbit, of which only about 900 were functional payloads — the rest being spent rocket bodies, explosion fragments, and defunct spacecraft. Although the absolute numbers seemed modest, Kessler and Cour-Palais, through rigorous mathematical modeling, foresaw a disturbing future: when the spatial density of objects exceeds a critical threshold, random collisions between debris will generate enough new fragments that the collisional process becomes self-sustaining and grows exponentially — even if humanity completely ceases all new launches.
This prediction later became widely known as Kessler Syndrome, and the 1978 paper is the origin of this concept. Notably, the paper itself never used the term "Kessler Syndrome" — this designation was later bestowed by the scientific community in recognition of Kessler's pioneering contributions to this field.
1.1 Historical Context and Problem Awareness
The historical backdrop of the paper is crucial for understanding its foresight:
- Limited Space Surveillance Capabilities: NORAD's Space Detection and Tracking System (SPADATS) could only track objects larger than approximately 10 cm in diameter. For smaller yet equally lethal debris (1–10 cm), there was virtually no monitoring capability.
- Frequent Explosion Events: During the 1970s, multiple US Delta rocket upper stages unexpectedly exploded in orbit, producing substantial debris clouds. These events alerted researchers that, beyond launch activities, "on-orbit generation" was a significant source of debris.
- Large Structure Programs: NASA was planning large space structures (such as space-based solar power stations), which possessed enormous cross-sectional areas that would significantly increase collision probability.
Against this backdrop, Kessler and Cour-Palais posed the central question: Does a critical spatial density exist, beyond which collision-generated debris will exceed naturally cleared debris, triggering irreversible exponential growth?
1.2 Core Contributions of the Paper
This 10-page paper made the following pioneering contributions:
- Established a mathematical model for debris collision frequency, organically unifying debris flux, spatial density, and collision cross-sectional area;
- Defined the concept of critical spatial density and derived its mathematical expression;
- Predicted the formation of a debris belt: in the 900–1,000 km altitude band, debris population would reach critical density within the coming decades;
- Proposed early ideas for debris environment management, including reducing explosion probability and controlling debris generation rates.
2. Core Model: The Mathematical Framework of Debris Collision Frequency
At the heart of the Kessler and Cour-Palais model lies a simple yet powerful relationship: debris collision frequency depends on spatial density, collision cross-sectional area, and the statistical distribution of relative velocities.
2.1 The Fundamental Collision Frequency Equation
Consider a target object (spacecraft or large debris fragment) in low Earth orbit with an effective collision cross-sectional area $A$. Over a time interval $\Delta t$, the expected number of collisions between this target and all other objects in the debris population is:
$$ N = A \cdot F \cdot \Delta t $$
where $F$ is the debris flux — the number of debris objects passing through a unit cross-sectional area per unit time. The flux $F$ further decomposes into the product of spatial density $S$ (number of objects per unit volume) and mean relative velocity $V$:
$$ F = S \cdot V $$
From this we obtain the collision frequency:
$$ \frac{dN}{dt} = A \cdot S \cdot V $$
This equation appears simple, but it embodies a critical physical insight: collision frequency scales linearly with spatial density $S$. This means that if the debris population doubles, the collision frequency also doubles — but as we will see below, once collisions begin generating new fragments, the spatial density $S$ itself grows with collision frequency, forming a positive feedback loop.
2.2 Spatial Density Distribution
Spatial density $S$ is not uniformly distributed but varies strongly with altitude $h$. Kessler and Cour-Palais used NORAD catalog data to derive the object spatial density for each altitude band:
$$ S(h) = \frac{N_{obj}(h)}{V_{shell}(h)} $$
where $V_{shell}(h)$ is the volume of the spherical shell at that altitude band, and $N_{obj}(h)$ is the number of objects within it.
Through analysis of NORAD data, the paper revealed several key characteristics of spatial density:
- Peak Region: The 800–1,000 km altitude band has the highest spatial density, hosting most polar-orbiting and Sun-synchronous satellites;
- Exponential Decay: Below approximately 500 km, atmospheric drag is significant, debris lifetimes are short (months to years), and spatial density drops rapidly;
- Long-Term Residence: Above 800 km, atmospheric density is extremely low, and debris orbital lifetimes can reach hundreds or even thousands of years — meaning that once debris is generated at these altitudes, it is virtually impossible to remove through natural mechanisms.
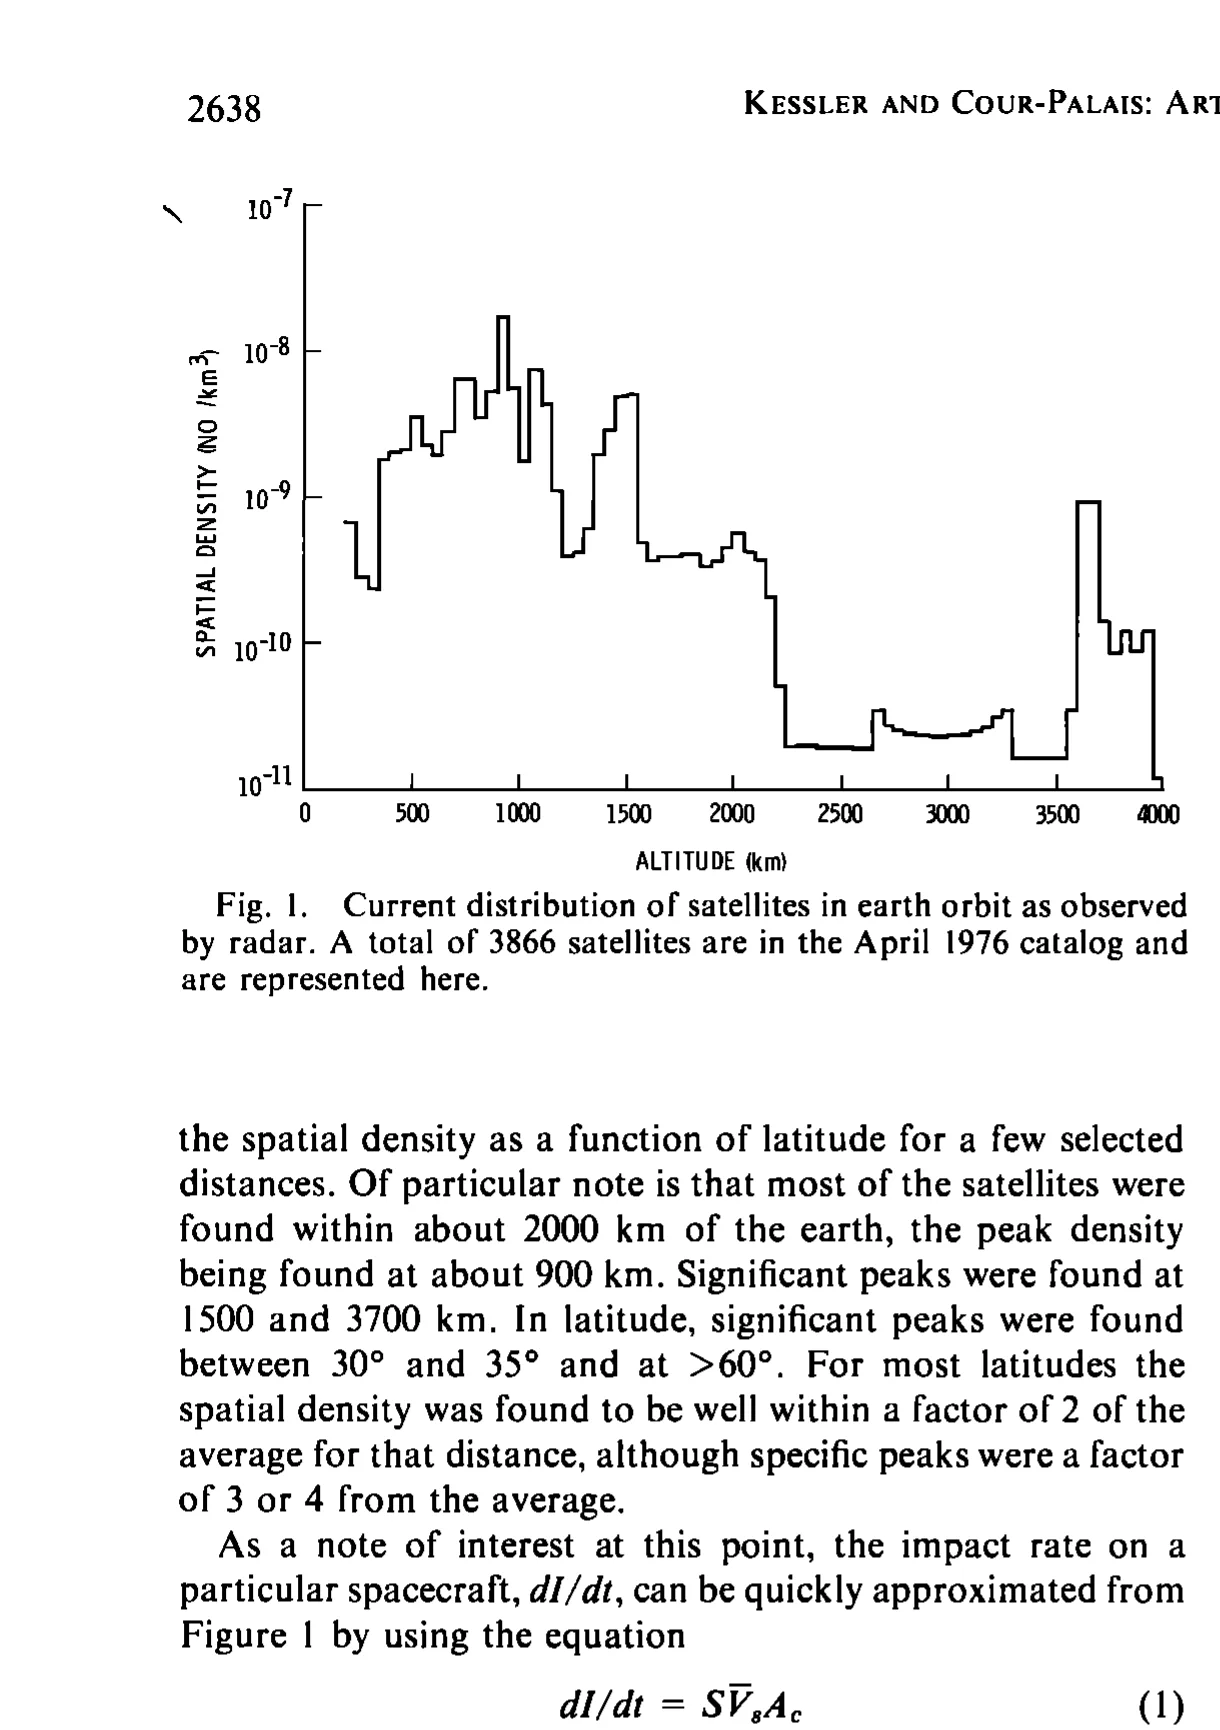
Figure 1: Spatial density distribution of 3,866 satellites from the April 1976 NORAD catalog as a function of altitude. The peak occurs near 900 km, with notable secondary peaks at 1,500 km and 3,700 km. Above 800 km, atmospheric density is so low that debris orbital lifetimes reach centuries.
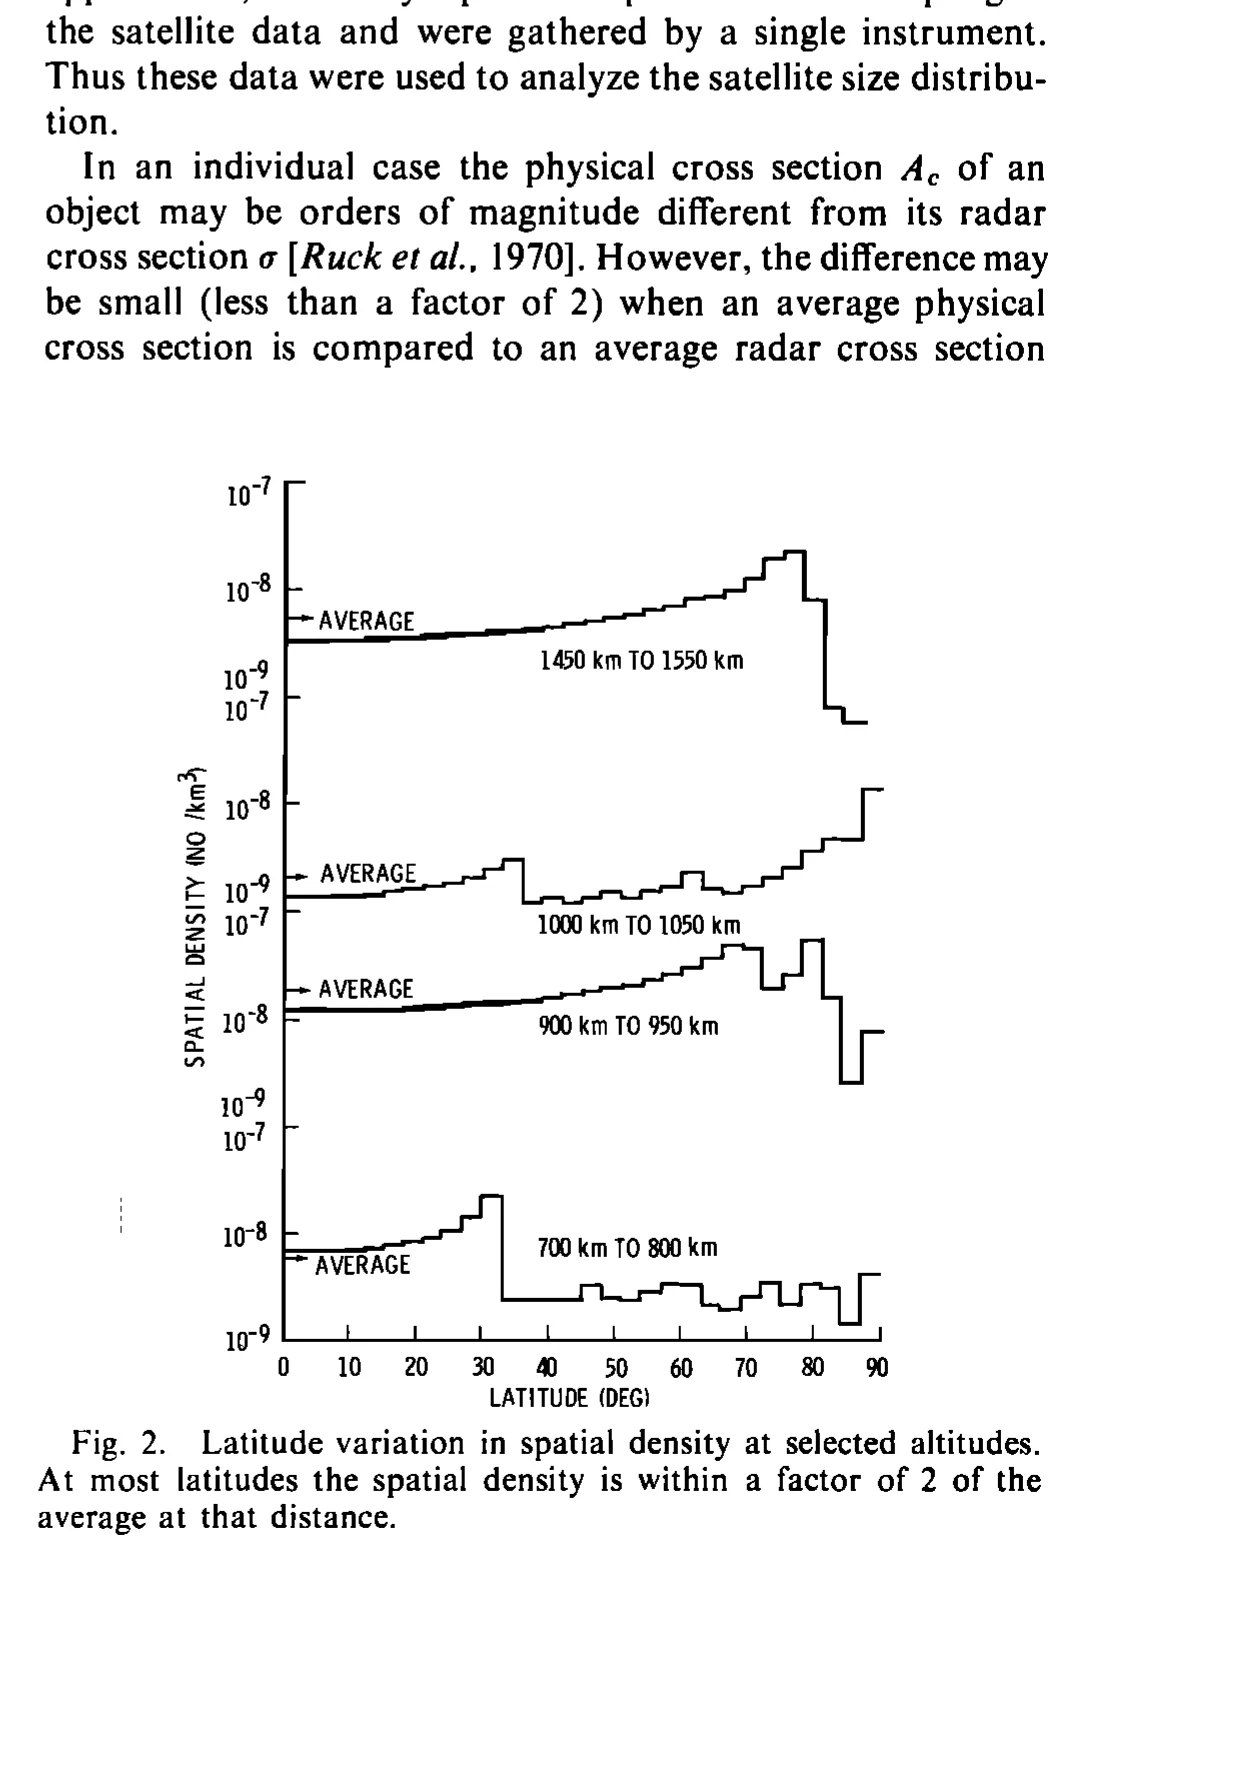
Figure 2: Latitude variation of spatial density at selected altitude bands. Four subplots show distributions for 700–800 km, 900–950 km, 1,000–1,050 km, and 1,450–1,550 km. At most latitudes, spatial density stays within a factor of 2 of the average.
2.3 Cross-Sectional Area and Equivalent Radius
The collision cross-sectional area $A$ depends on the physical size of the target object. The paper employs an equivalent radius $R_{eq}$ to uniformly treat irregularly shaped fragments:
$$ A = \pi R_{eq}^2 $$
For spacecraft and rocket bodies, the equivalent radius is typically taken as half of the maximum dimension. For example, a rocket body of 3 m diameter has a collision cross-sectional area of $A \approx 7.07\text{ m}^2$.
Special Risk from Large Structures: The paper specifically discussed planned large space structures (such as space-based solar power stations, which could span several square kilometers). Such structures possess cross-sectional areas orders of magnitude larger than conventional satellites, and their collision frequencies would be disproportionately high — a $1\text{ km}^2$ structure in the peak spatial density region could expect several collisions per year.
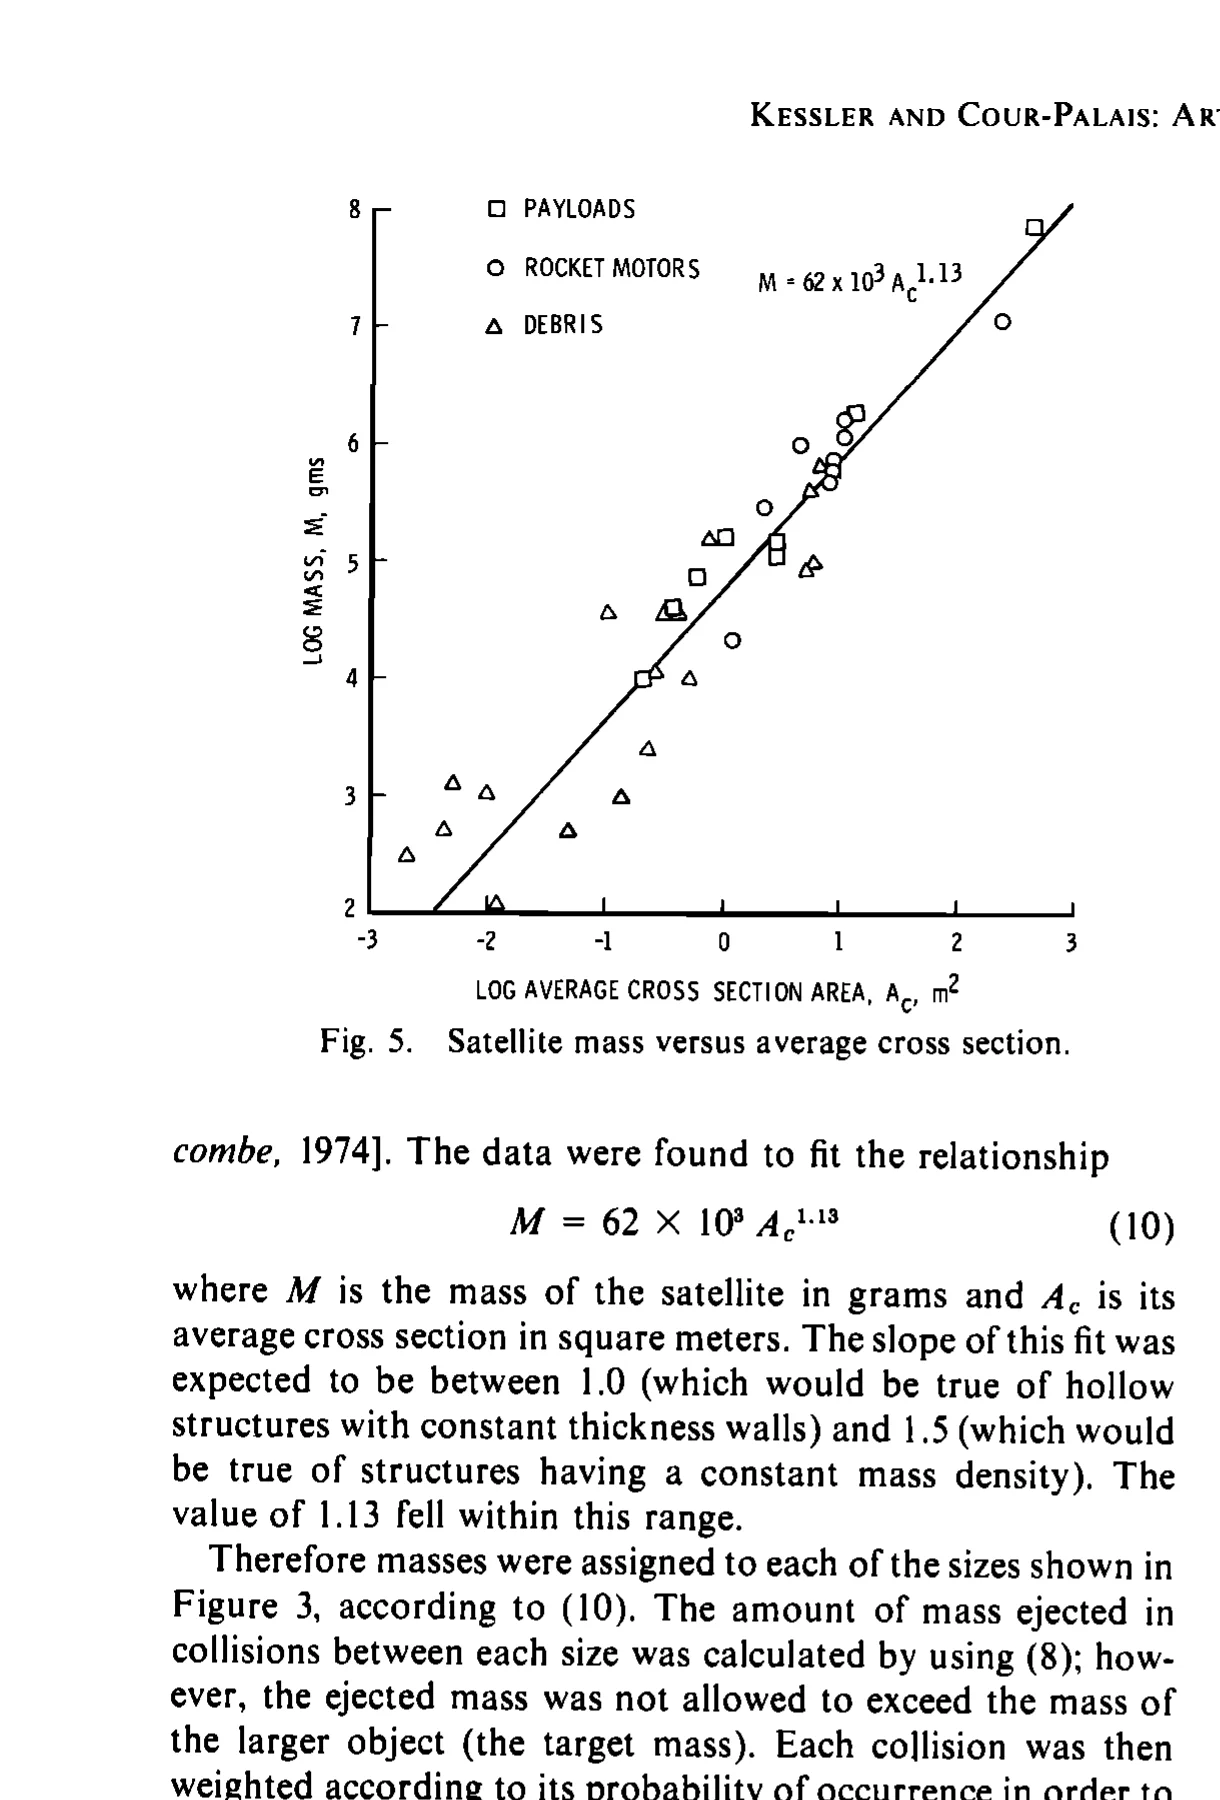
Figure 5: Scatter plot of satellite mass versus average cross-sectional area. Squares represent payloads, circles represent rocket motors, and triangles represent debris. The fitted line $M = 62 \times 10^3 A_c^{1.13}$ falls between the theoretical slopes for hollow structures (1.0) and constant-density structures (1.5).
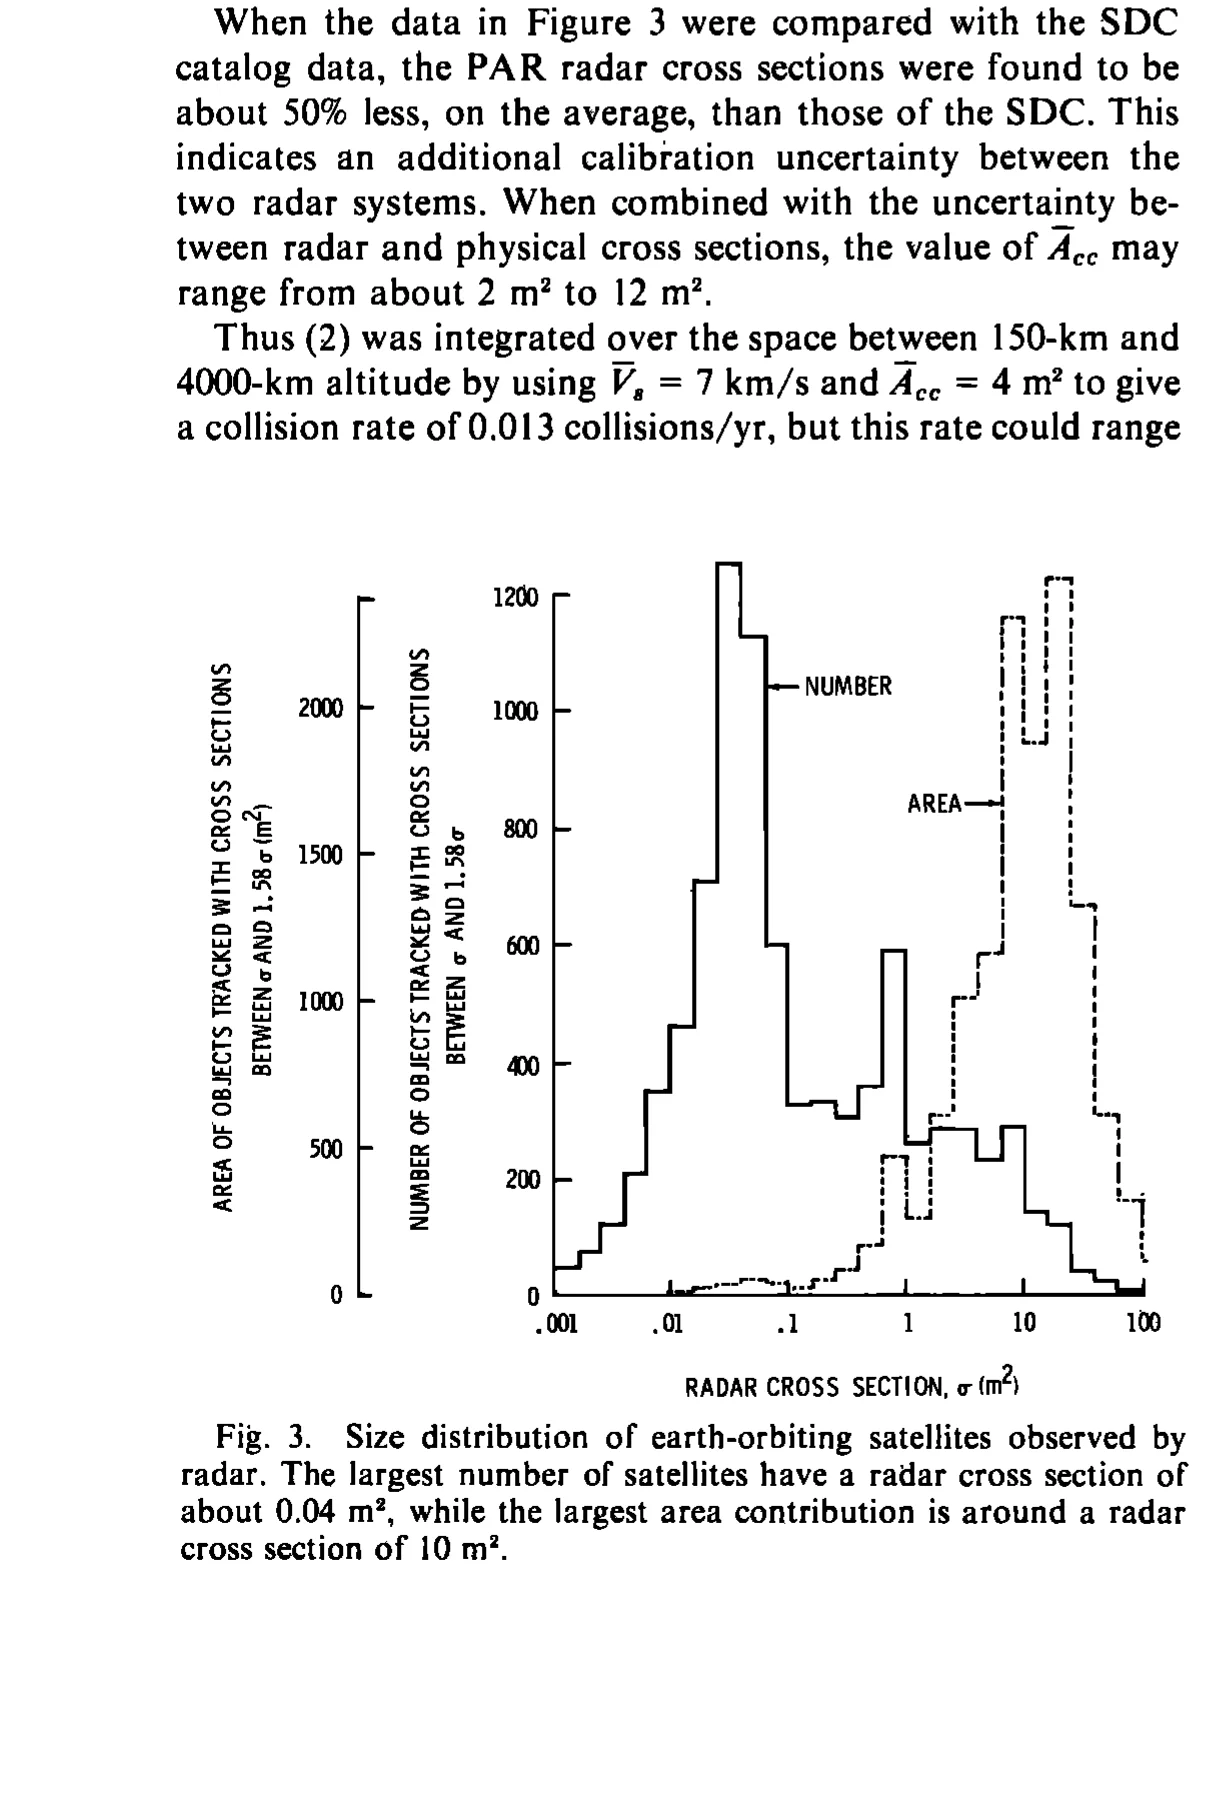
Figure 3: Size distribution of Earth-orbiting satellites from a 12-hour PAR radar test in July 1976. The solid line shows the number of objects (right axis), peaking at ~0.04 m² radar cross section; the dashed line shows the area contribution (left axis), peaking at ~10 m². Approximately 90% of total satellite area is concentrated in 20% of the largest satellites.
2.4 Debris Source Model
The collision frequency equation describes the rate at which debris is "consumed," but to establish a complete debris environment evolution model, one must also account for the rate at which debris is "generated." The paper identified three sources of debris:
(1) Launch Activity: Each launch injects a payload and a rocket body into orbit. Assuming an annual launch rate of $\dot{N}_L$, the number of new intact objects added each year is $\dot{N}_L$.
(2) On-Orbit Explosions: Residual propellants in rocket upper stages may explode due to thermal cycling, micrometeoroid impacts, or other causes. Based on historical data, the paper assumed that each object in orbit has an annual explosion probability of $P_{exp}$, with each explosion producing $N_{frag}$ catalogable fragments.
(3) Collisions: When two objects undergo a hypervelocity collision (typical LEO collision speeds are 10–14 km/s), the number of new fragments produced depends on the collision energy. The paper defined a key quantity — the multiplication factor $M$: the ratio of the number of catalogable fragments produced in a collision to the number of pre-collision target objects. For catastrophic collisions (complete target breakup), $M \gg 1$; for non-catastrophic collisions, $M$ may be close to 1.
3. Key Conclusions: Critical Density and the Formation of a Debris Belt
3.1 Derivation of Critical Spatial Density
The paper's most profound insight lies in the derivation of the instability criterion for the debris environment. Consider the time evolution of the debris population $N$:
$$ \frac{dN}{dt} = \dot{N}_{source} - \dot{N}_{sink} $$
where $\dot{N}_{source}$ includes new fragments from launches, explosions, and collisions, and $\dot{N}_{sink}$ represents debris lost through atmospheric drag de-orbit.
When the spatial density reaches a certain critical value $S_{crit}$, the rate of new fragment generation from collisions exactly matches the natural decay rate. Once $S_{crit}$ is exceeded, even if the launch and explosion contributions to $\dot{N}_{source}$ drop to zero, collisions alone generate enough new fragments to sustain continuous growth of the debris population — this is the mathematical essence of Kessler Syndrome.
The critical spatial density $S_{crit}$ relates to the following parameters:
$$ S_{crit} \propto \frac{1}{V \cdot A \cdot M \cdot \tau} $$
where $\tau$ is the mean orbital lifetime of debris at that altitude. This relationship reveals several key implications:
- At higher altitudes (larger $\tau$), $S_{crit}$ is lower — meaning critical density is more easily reached in higher orbits;
- The presence of large structures (larger $A$) lowers $S_{crit}$ — exacerbating the risk of reaching critical density;
- If collisions are catastrophic (large $M$), $S_{crit}$ is further lowered.
3.2 Numerical Predictions: When Will the Debris Belt Form?
Based on NORAD catalog data and the model described above, Kessler and Cour-Palais performed numerical predictions of the debris environment across different altitude bands. Their core findings included:
(1) 900–1,000 km is the "Danger Zone"
This altitude band hosts a high concentration of decommissioned polar-orbiting satellites and spent rocket bodies, with extremely low atmospheric density and orbital lifetimes reaching centuries. The paper predicted that the debris spatial density in this region would approach the critical value within 30–40 years — that is, approximately around 2000–2010.
(2) The Formation Mechanism of the Debris Belt
Once the debris density in the 900–1,000 km region exceeds the critical threshold, a single catastrophic collision will produce a large number of new fragments. These fragments will spread to adjacent altitude bands, triggering more collisions and forming a debris belt encircling the Earth, analogous to a microscopic version of Saturn's rings. One passage from the paper is particularly sobering:
"The result would be an exponential increase in the number of objects with time, creating a 'belt of debris' around the Earth."
(3) The Time Scale of Debris Multiplication
The paper estimated that once debris density exceeds the critical threshold, the doubling time for the debris population is on the order of 10–40 years, depending on the altitude and initial density. This means that Kessler Syndrome is not a sudden "switch" event but a gradually accelerating process — appearing slow on human timescales, yet from the perspective of orbital environment timescales, it represents a geological-scale catastrophe already underway.
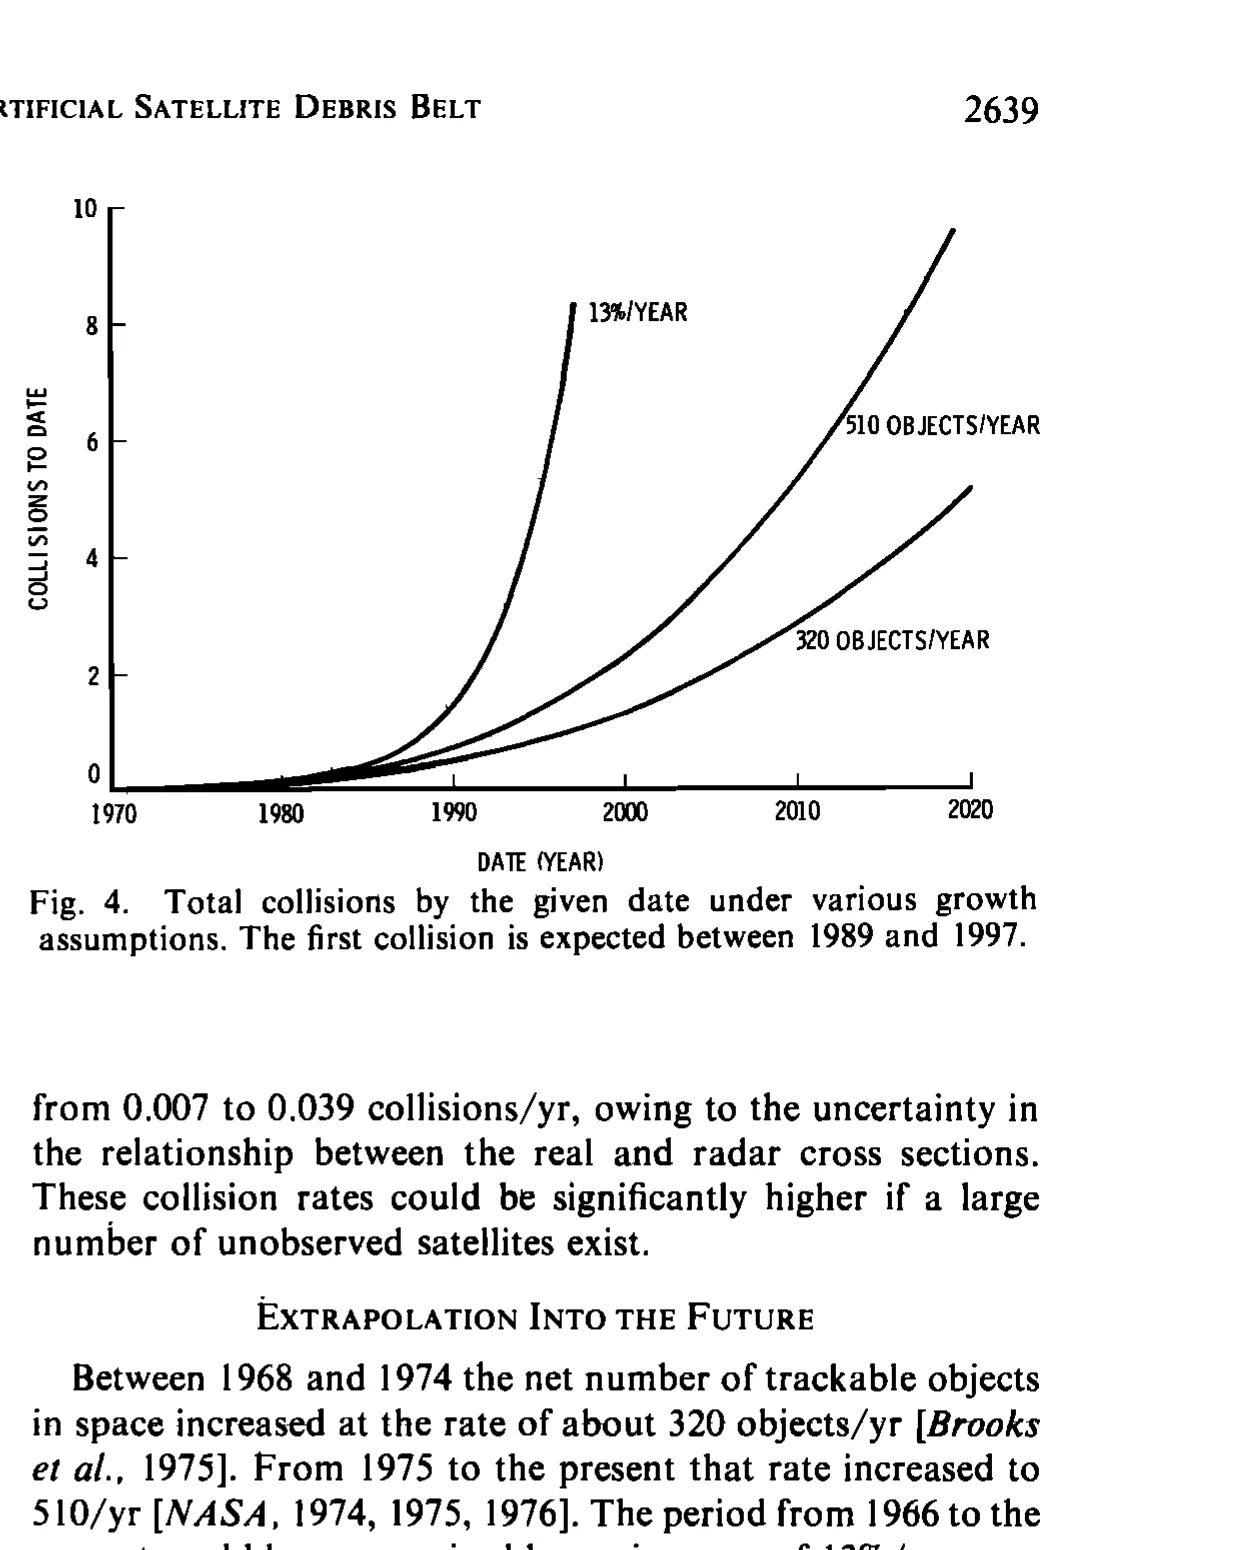
Figure 4: Predicted cumulative collisions under three growth assumptions. The steepest curve (13%/year) assumes exponential satellite population growth; the middle curve (510 objects/year) reflects the post-1975 observed growth rate; the shallowest (320 objects/year) reflects the 1968–1974 historical rate. The paper predicted the first collision would occur between 1989 and 1997.
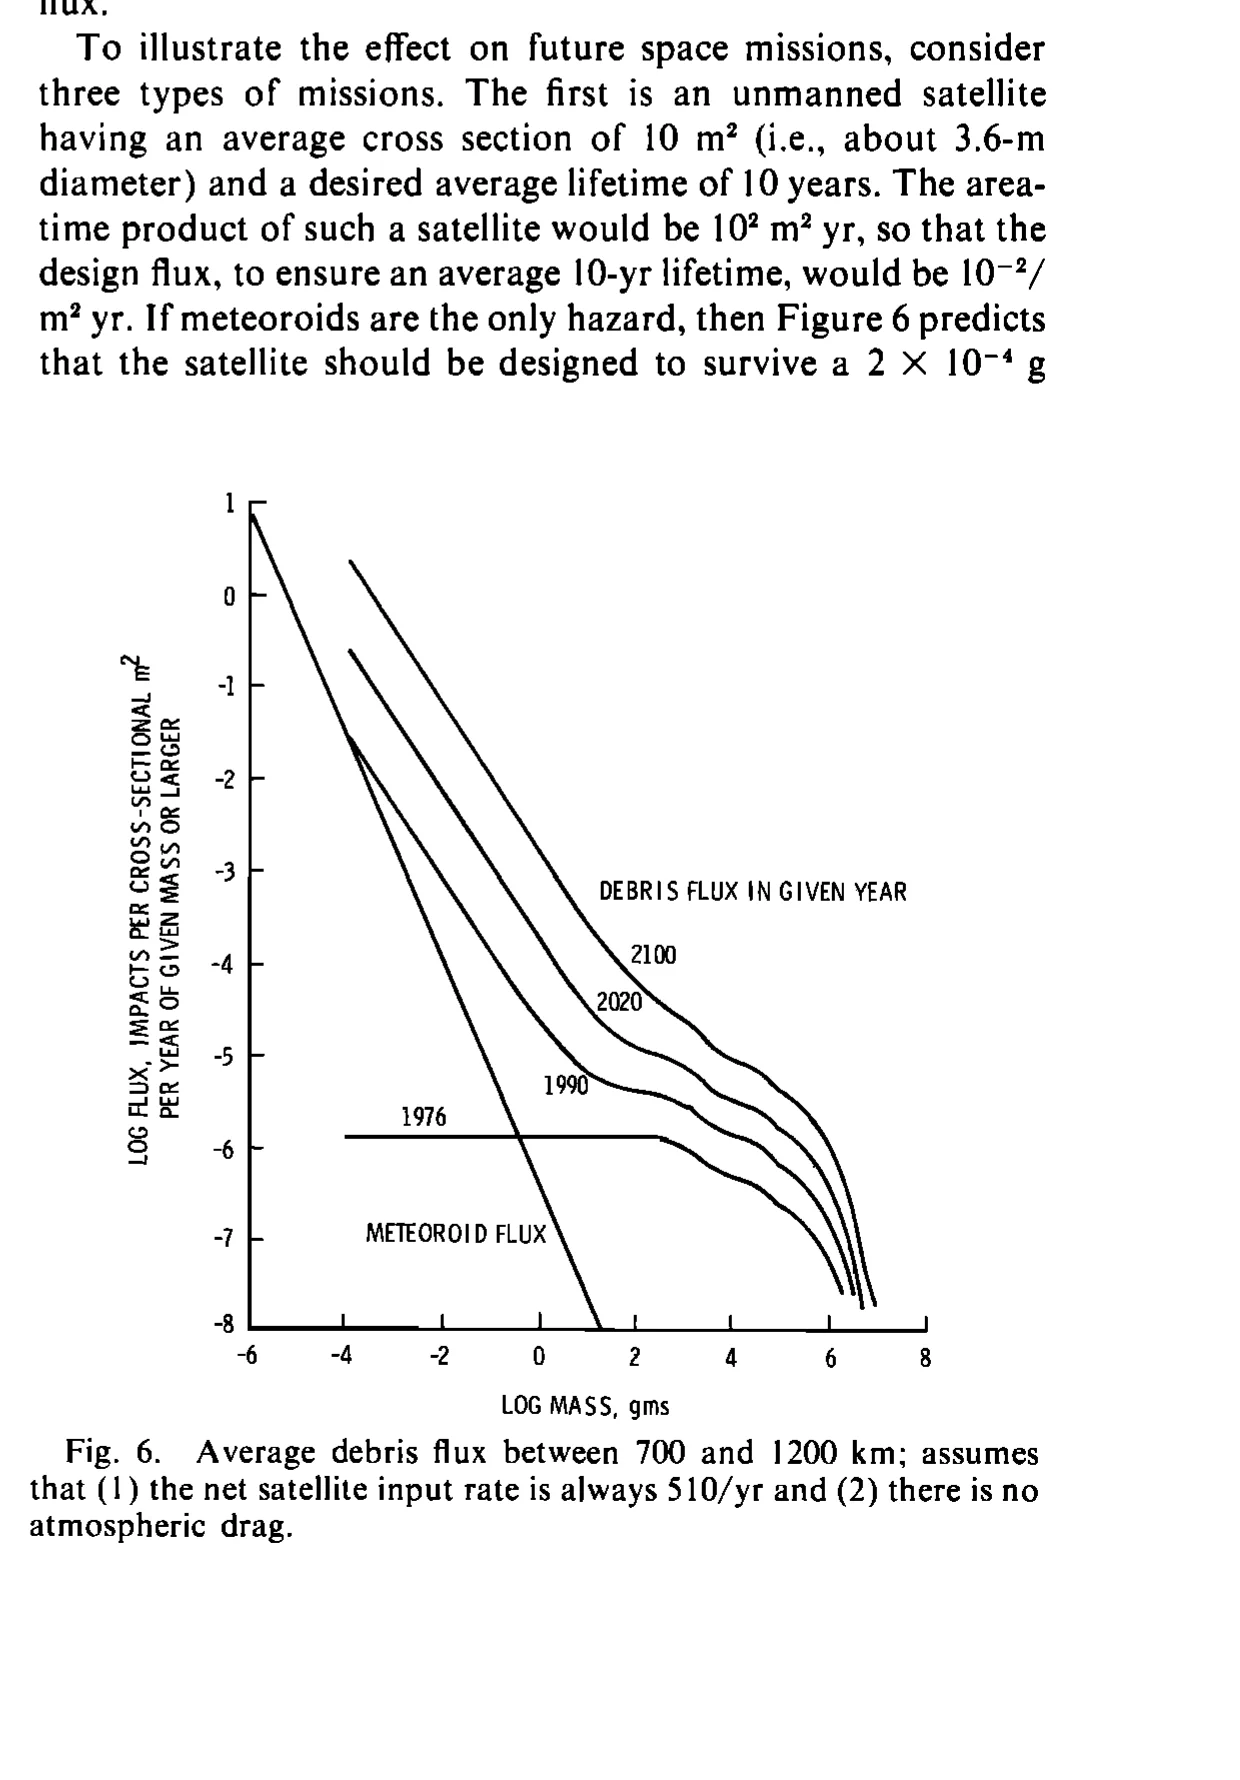
Figure 6: Average debris flux in the 700–1200 km altitude band, projected for 1976, 1990, 2020, and 2100. Assumes a constant net satellite input rate of 510/year with no atmospheric drag. Over time, the debris flux curves shift upward and rightward, exceeding the natural meteoroid flux across most mass ranges after 2020.
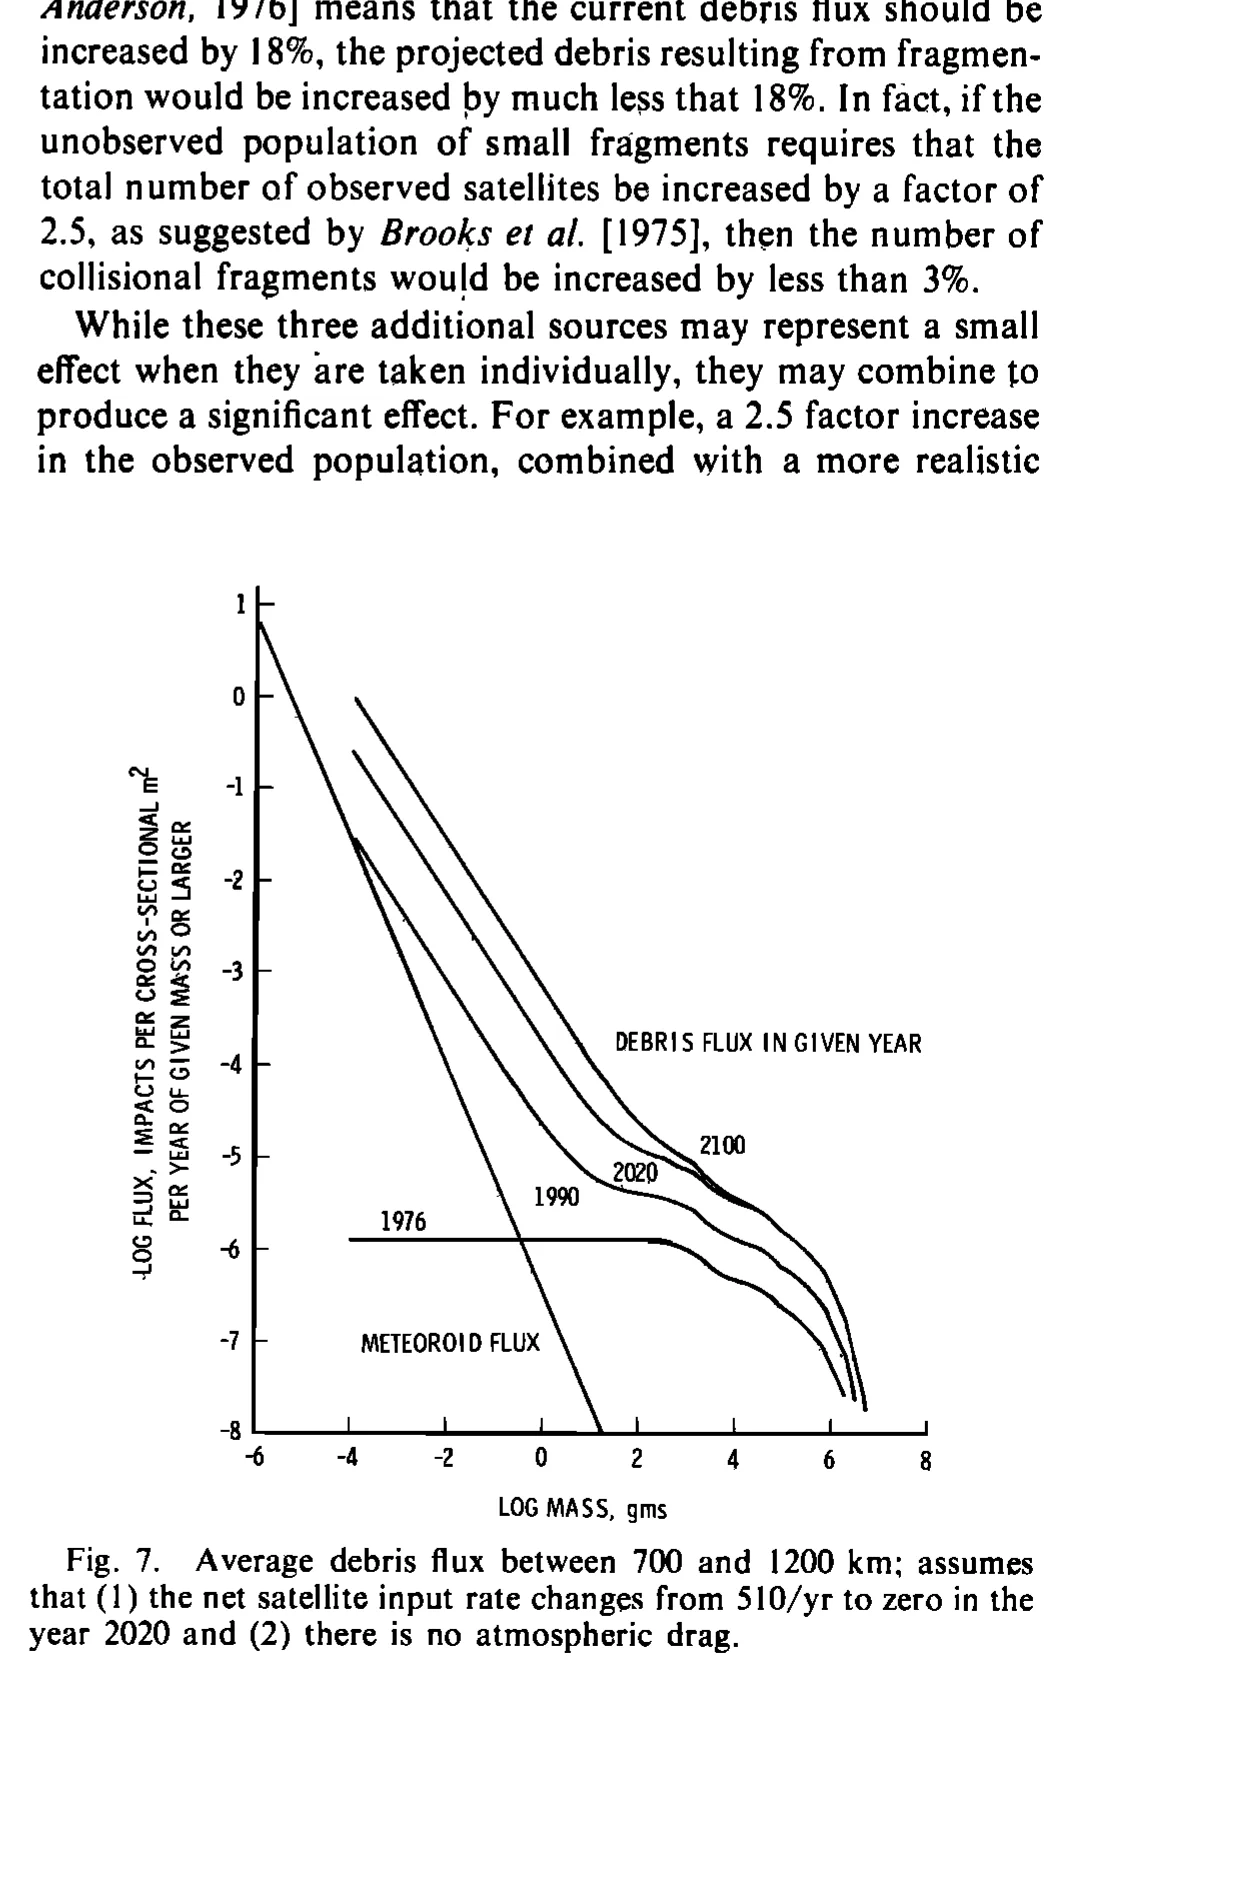
Figure 7: Same spatial region as Fig. 6, but assuming the net satellite input rate drops to zero in 2020 with no atmospheric drag. Even with a complete launch cessation, collisional cascading drives continued debris flux growth through 2100 — the numerical validation of Kessler Syndrome.
3.3 Empirical Validation: The Model's Prescience
The predictions of Kessler and Cour-Palais have been validated in multiple ways over subsequent decades:
- 2007: China's anti-satellite test (FY-1C) at approximately 860 km altitude produced over 3,000 catalogable fragments, dramatically increasing the spatial density in that altitude band;
- 2009: The Iridium 33–Kosmos 2251 collision at 789 km altitude generated over 2,000 catalogable fragments — the first accidental collision between two intact satellites in human history, directly validating the Kessler collision frequency model;
- 2010s–Present: The deployment of mega-constellations such as Starlink has further increased spatial density in the 500–600 km altitude band, elevating collision risk even in what were previously considered relatively "safe" low-altitude regions.
Notably, the 2008 LEGEND simulations by Liou and Johnson (the paper reviewed in Post #4 of this series) confirmed at higher fidelity the core conclusion of Kessler's 1978 paper: even with a complete cessation of launches, collisional cascading will drive continued growth in the debris population.
4. Discussion and Implications (To be continued)
[The following is the draft incomplete section — 50% completion mark]
4.1 The Methodological Legacy of the Paper
The collision frequency–spatial density framework established by Kessler and Cour-Palais remains, to this day, the theoretical foundation for all debris environment evolution models. From NASA's LEGEND model to ESA's DELTA model, to the common reference models of the Inter-Agency Space Debris Coordination Committee (IADC), all can trace their lineage back to the fundamental equations of this 1978 paper.
4.2 Implications for Active Debris Removal (ADR)
One of the core implications of Kessler Syndrome is that: mitigation alone — such as the 25-year deorbit rule — is insufficient to reverse the deteriorating trend of the debris environment. Active Debris Removal (ADR) is necessary to remove large objects from critical orbital regions and bring spatial density back below the critical threshold.
The paper indirectly spurred the development of the ADR concept. Subsequent research (such as Liou's 2011 ADR prioritization analysis) explicitly identified that removing 5–10 of the largest objects per year from the 900–1,000 km region can effectively suppress collisional cascading — the physical basis for this strategy is precisely the critical spatial density concept defined in Kessler's 1978 paper.
4.3 Current Status and Outlook
[Content to be completed]
Appendix: Figures from the Original Paper(论文原图集)
Below is the complete set of all 12 figures from Kessler & Cour-Palais (1978), presented in order of appearance with bilingual Chinese-English captions.
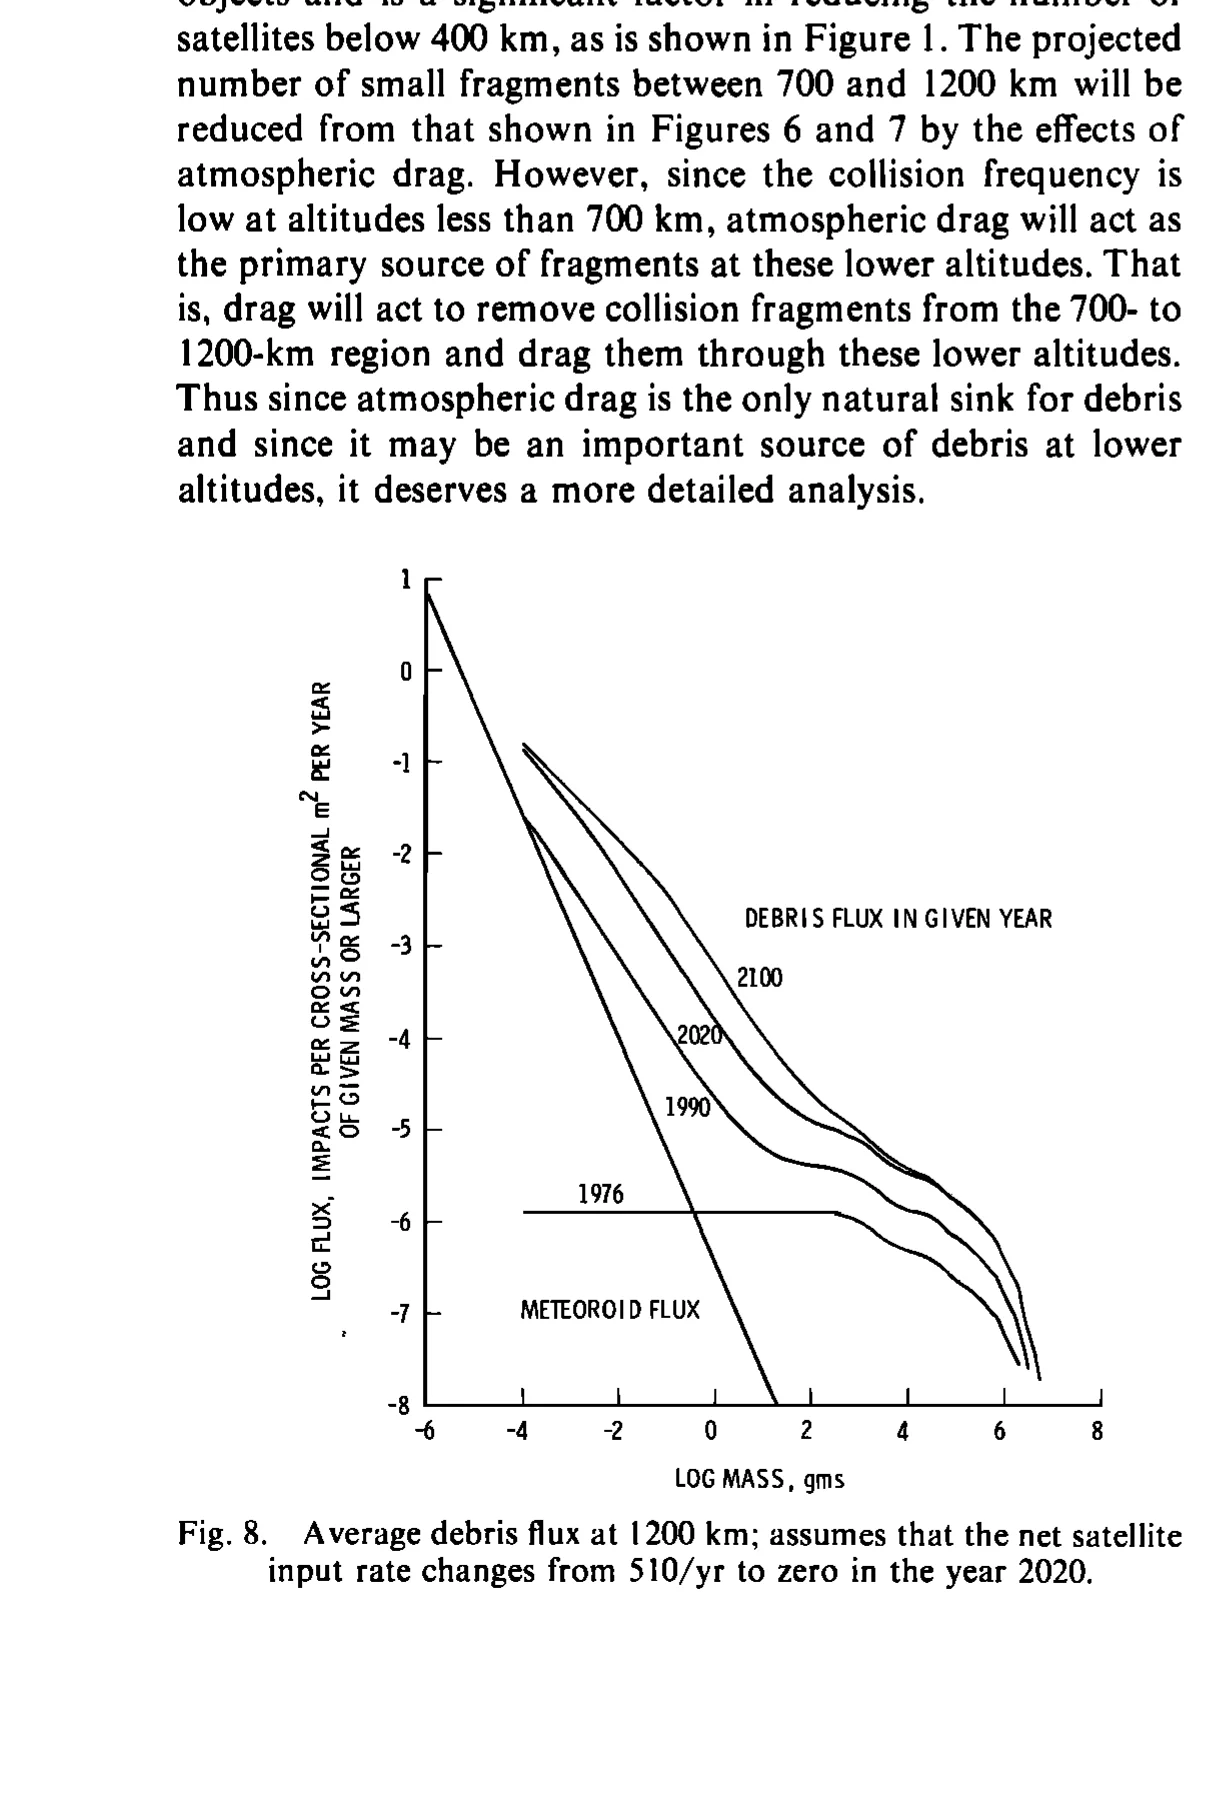
Figure 8: Average debris flux at 1200 km incorporating atmospheric drag. Compared with Fig. 7, drag significantly removes fragments smaller than 0.1 g, but has negligible effect on fragments larger than ~10² g. Net input rate drops to zero in 2020.
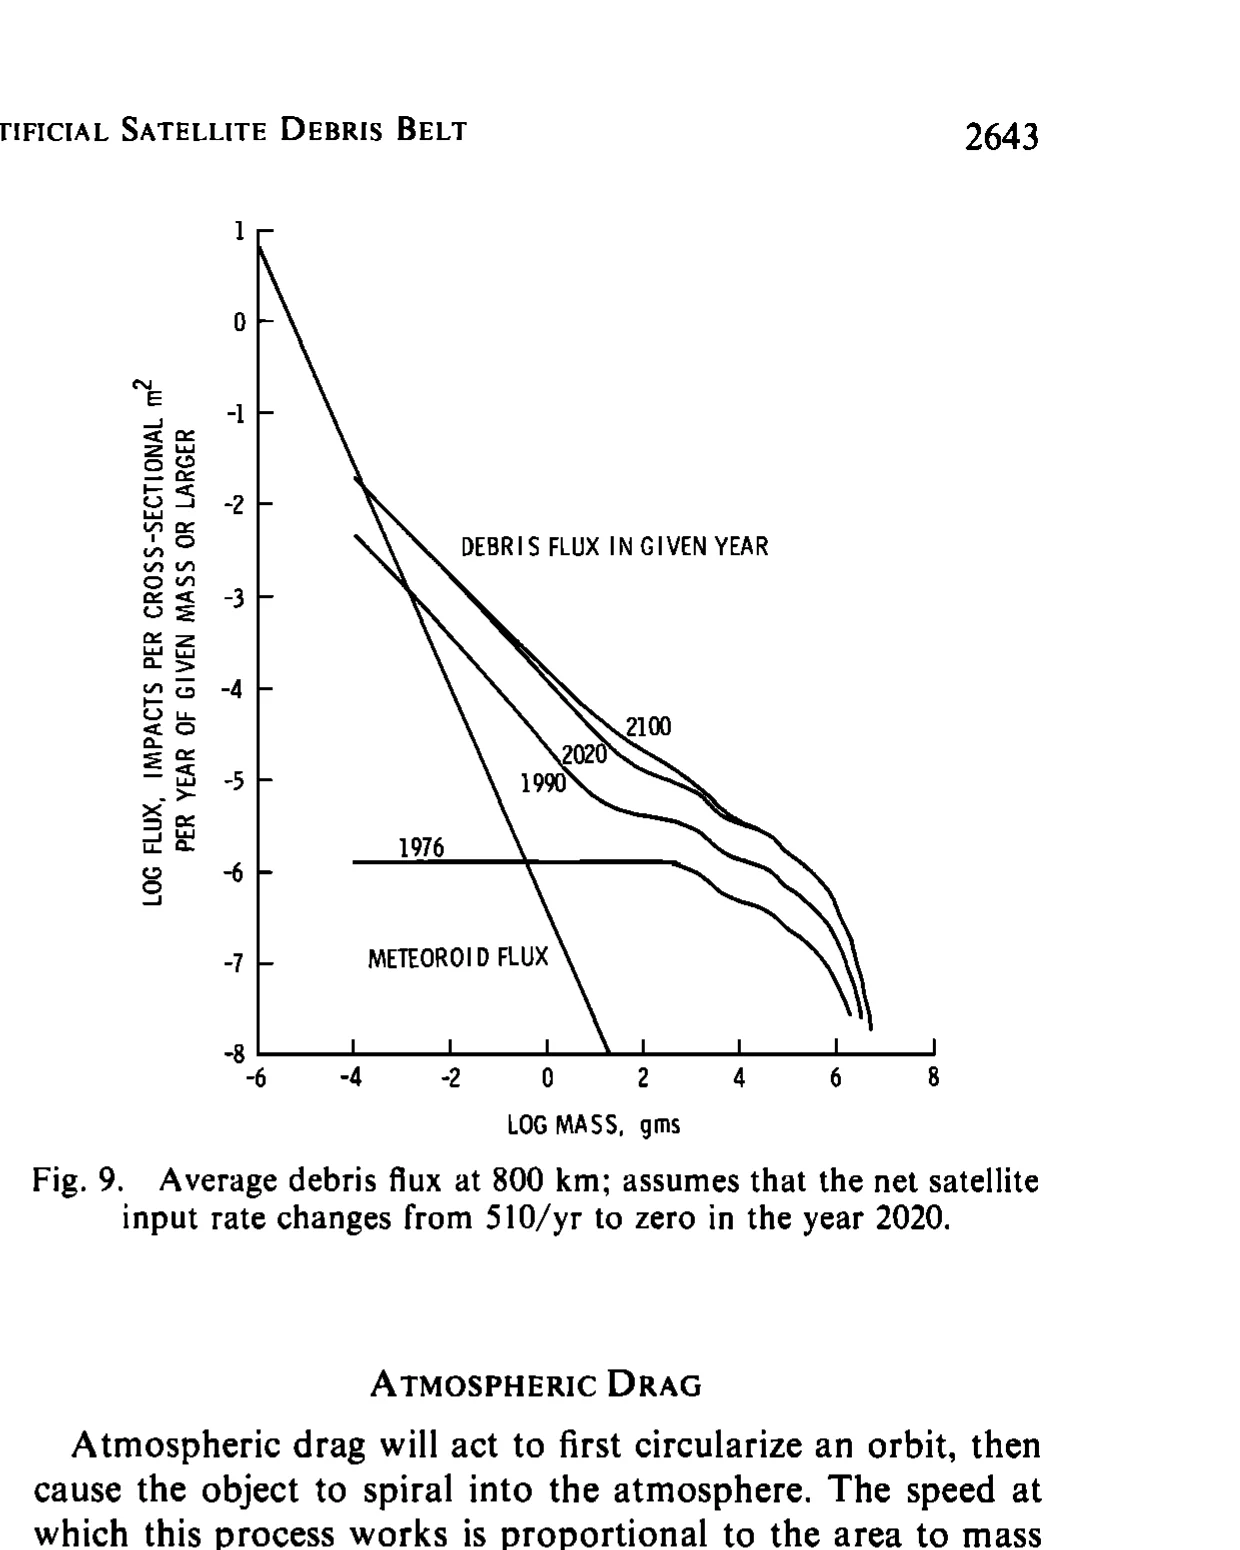
Figure 9: Average debris flux at 800 km incorporating atmospheric drag. At 800 km, stronger drag establishes a near-equilibrium shortly after 2020 — collision-generated fragments are removed by drag at approximately the same rate they are produced.
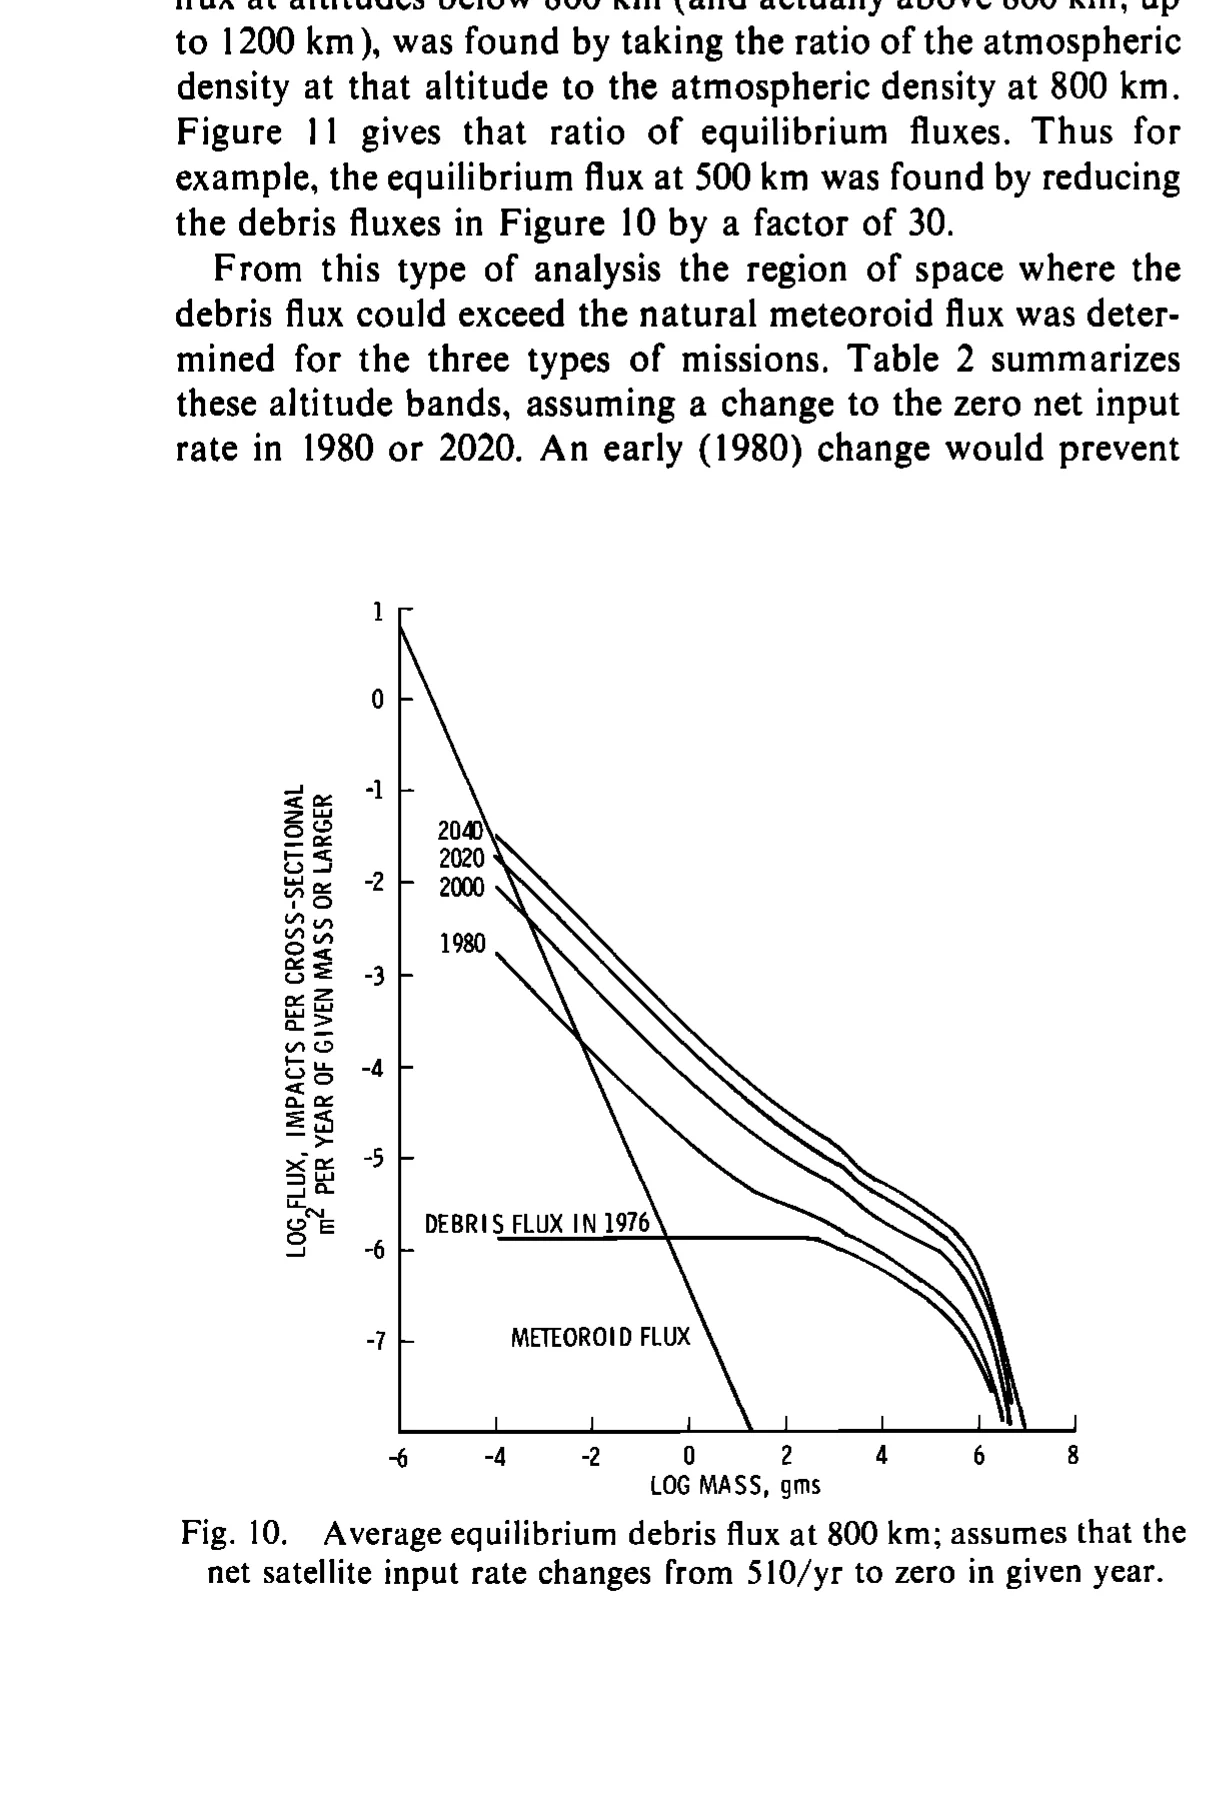
Figure 10: Equilibrium debris flux eventually reached at 800 km when the net input rate drops to zero in different years (1980, 2000, 2020, 2040). The earlier the cessation, the lower the final equilibrium flux. A 1980 cutoff spares unmanned satellites; a 2040 cutoff endangers even space stations.
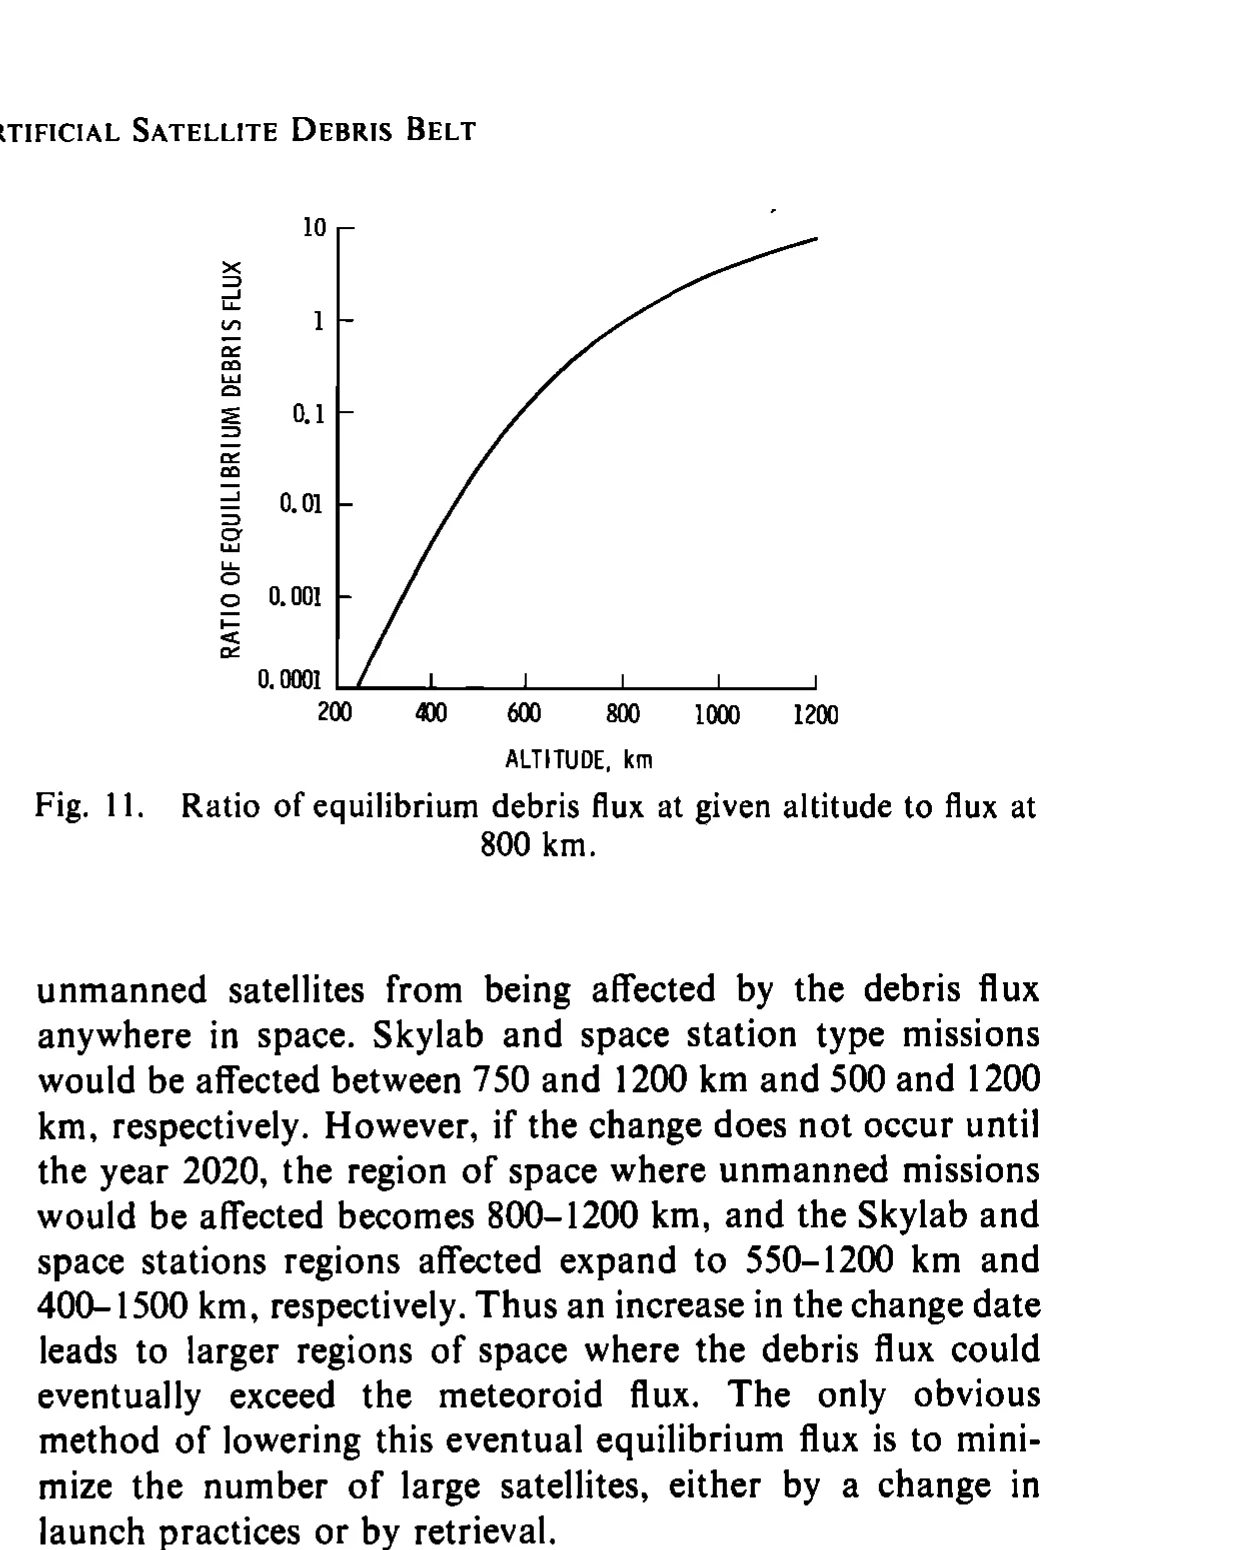
Figure 11: Ratio of equilibrium debris flux at a given altitude to that at 800 km. The curve reveals exponential growth with altitude — the equilibrium flux at 1200 km is roughly 10× that at 800 km, because atmospheric density decays exponentially, making natural removal far slower at higher orbits.
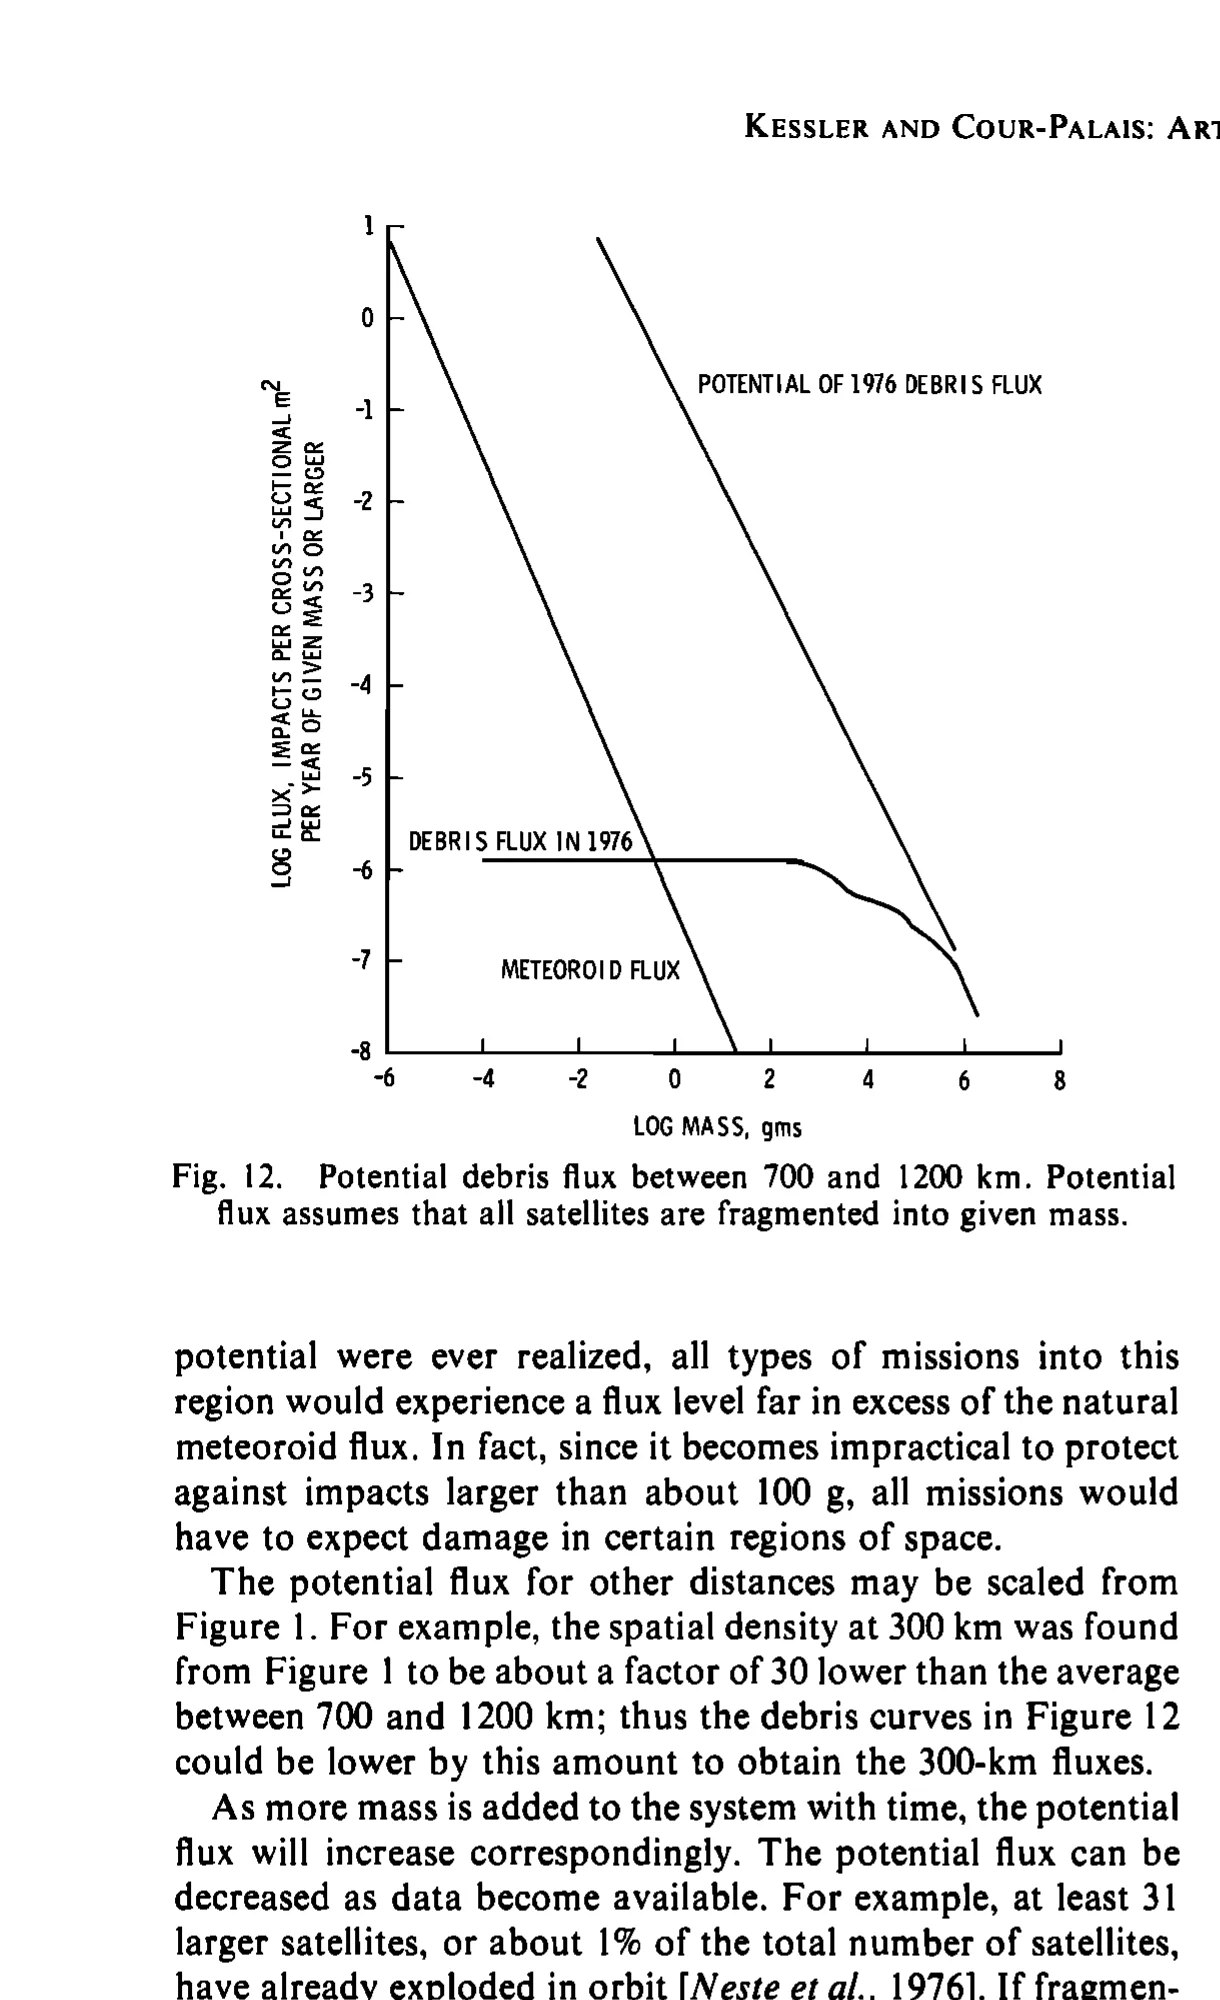
Figure 12: "Potential" debris flux in the 700–1200 km band. This curve assumes all satellite mass fragments into a single preferred size, representing the worst-case flux ceiling. If realized, all mission types in this region would face debris flux far exceeding the natural meteoroid background.
References
-
D. J. Kessler and B. G. Cour-Palais, "Collision Frequency of Artificial Satellites: The Creation of a Debris Belt," Journal of Geophysical Research: Space Physics, Vol. 83, No. A6, pp. 2637–2646, 1978. DOI: 10.1029/JA083iA06p02637
-
J.-C. Liou and N. L. Johnson, "Risks in Space from Orbiting Debris," Science, Vol. 311, No. 5759, pp. 340–341, 2006.
-
J.-C. Liou and N. L. Johnson, "Earth Satellite Population Instability: Underscoring the Need for Debris Mitigation," NASA Johnson Space Center, 2008.
-
J.-C. Liou, "An Active Debris Removal Parametric Study for LEO Environment Remediation," Advances in Space Research, Vol. 47, No. 11, pp. 1865–1876, 2011.
-
D. J. Kessler et al., "The Kessler Syndrome: Implications to Future Space Operations," 33rd Annual AAS Guidance and Control Conference, AAS 10-016, 2010.
This article is the seventh installment in the "Classic Paper Review" series. This series is dedicated to interpreting foundational classic papers in the fields of space debris and orbital safety, tracing the core intellectual lineage of the discipline's development.